|
There are times when we have too many data points to see an error bar on each of the points, and it is generally better at those times to see the error bar only at certain places (for example, every 50th data point) but we would like to avoid not plotting the interim points. This can be achieved by the often overlooked behaviour of not drawing the points which have the value NaN. Consider the following example:
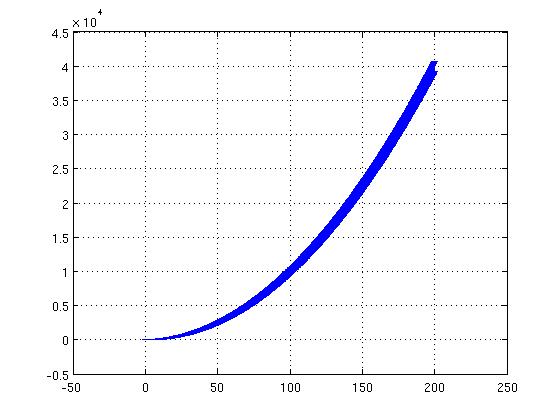
>> b = (1:1000) / 5;
>> a = b .^ 2;
>> err = b * rand * 50
>> errorbar( b, a, err );
Will produce a graph like figure 11:
However, the error bars are not very interesting at all points, hence:
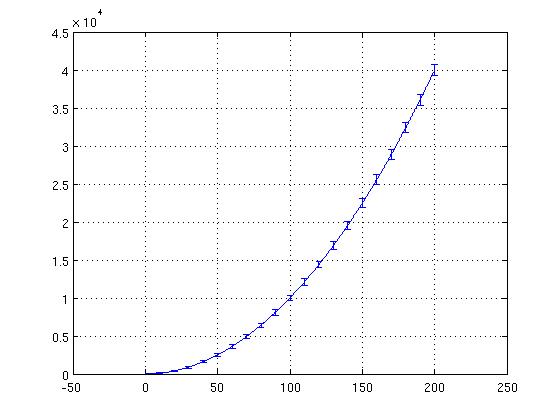
>> err( find( mod( 1:length(b), 50 ) > 0 ) ) = NaN;
>> errorbars( b, a, err );
Will produce a graph as shown in figure 12:
What this does is sets all the err as NaN at all places except where the index is divisible by 50. Hence, we see the error bars only at the indexes which are multiples of 50, making the graph much clearer.